The post Daily Stat page – Second Menu appeared first on MiBase New Zealand.
]]>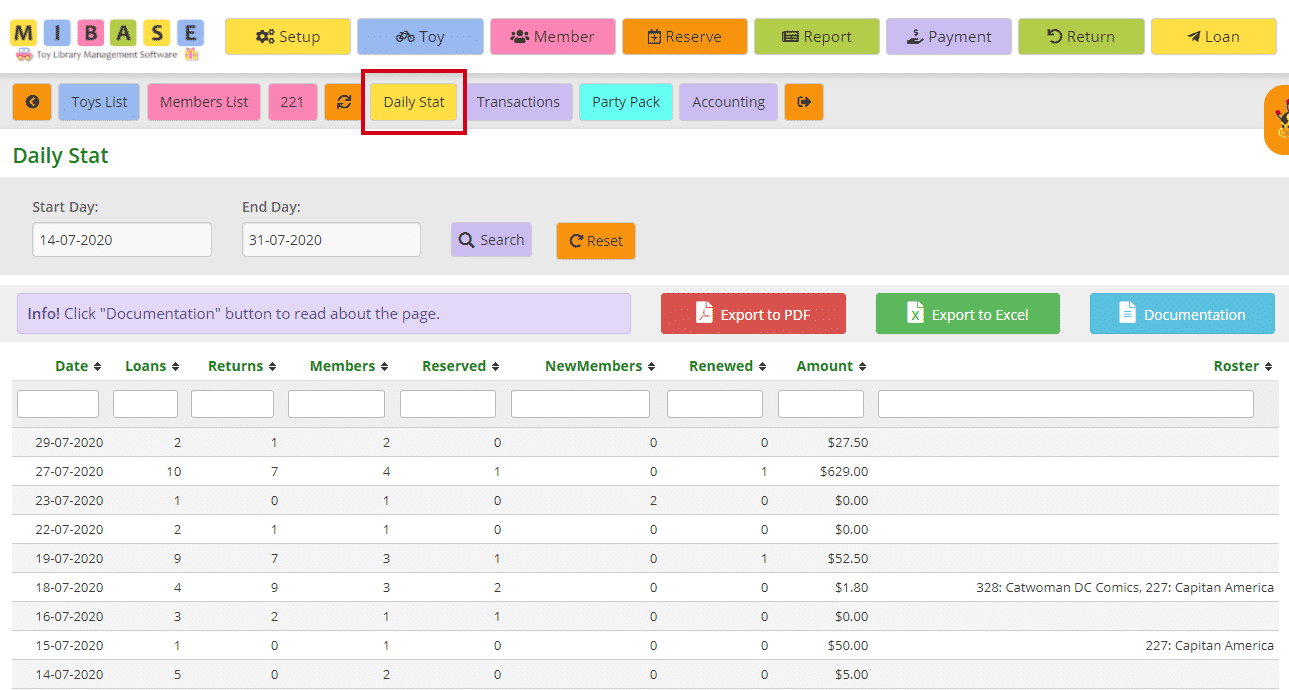
The most recent sessions will be listed first.
If you wish to view sessions in a given period, select the Start Day and End Day from the dropdown calendars, and click Search.
Click Reset to refresh the page to the current library sessions.
- Date: usually the day the library is opened however dates can appear for days not opened if a member has reserved a toy online or a new member joins online or if admin is working in the system out of hours.
- Loans: number of toy loans during that session
- Returns: number of toy returns during that session
- Members: how many members came into the library during that session
- Reserved: how many toys were reserved during that session
- NewMembers: number of new members that signed up during that session, an admin added a member or/and a member joins online
- Renewed: number of membership renewals during that session
- Amount: total amount of money received for that day for all transactions
- Roster: lists the member/s who completed a duty for that session
*Note: the name will only show if an admin has clicked ‘Complete’ in the Duty Roster page
You can download this list to PDF and/or Excel by clicking the Export to PDF or Export to Excel buttons. This will export the full list. If you want to download a filtered list, either use the date range option mentioned above OR export to excel and sort or filter through there.
The post Daily Stat page – Second Menu appeared first on MiBase New Zealand.
]]>The post Members Stat page appeared first on MiBase New Zealand.
]]>To see the full list of statistics for each member, go to Member -> Members Stat

You can see in the list below specific information for each member.

- id: the member’s id number
- FullName
- Joined: the date the member joined
- LastRenewed: the date the membership was last renewed
- Expire: the date the membership expires. If it is highlighted red, the membership has already expired, blue, the membership will expire soon.
- MemberType: membership type
- Status: active, locked or resigned
- Children: the number of children recorded for each member
- TotLoan: the number of toys the member has hired since joining
- TotDuties: the total number of duty hours the member has completed since joining.
- TotSpent: the total amount of money the member has spent since joining. This includes rent, membership, toy hire, etc.
- TotValue: the total of how much the member would spend if he/she bought the toys instead of hiring them. This figure is only accurate if toys have a cost against them
- TotVisits: how many visits the member makes to the library whether it’s for a toy loan, toy return, duty or payment
To sort or filter the list, click the arrows next to the heading you want to sort or filter the list by or type in the search boxes underneath the headings.
You can also download the list to PDF and/or Excel by clicking the Export to PDF or Export to Excel buttons. This will export the full list, not a filtered list. If you want to download a filtered list, export to excel and sort or filter through there.

The post Members Stat page appeared first on MiBase New Zealand.
]]>The post Using the Dynamic Dashboard page appeared first on MiBase New Zealand.
]]>Go to Setup -> Dynamic Dashboard 
You will see a list of the different charts available with some default charts displayed. To de-activate these charts or to activate others, all you need to do is check the box alongside the chart you would like and click Show. For all ‘Financial and Loans’ charts, you can also choose a financial year from the dropdown menu underneath. If your toy library operates around a different financial year that is not listed, please contact us and we can add it in for you.

The charts are grouped by category. For all charts, if you hover your mouse over a bar or box or segment of the chart, it will display a total figure.
Note: some charts will mention ACTIVE members, remember expired members are also active!
Kids
- Kids gender: a pie chart displaying the total number of Males, Females, or Not recorded. It will only show for ACTIVE members. You can click an item on the legend to remove one gender from the chart, for example, click Not recorded and you will only see Males and Females.

- Kids age: a bar chart with all the kids’ ages for the ACTIVE members.

- Kids by age and gender: a bar chart with a composition of the kids’ ages and kids gender. You can click an item on the legend to remove one gender from the chart, for example, click Not recorded and you will only see Females and Males.

Members
- Membership: a pie chart displaying all your memberships. Very easy to see which one is the most used.

- Member’s Suburbs: a doughnut chart displaying the suburbs your ACTIVE members are living in.

- Member on Duty per month: a bar chart displaying the number of members that completed a duty during the current year starting from the previous month when you accessed this chart. For example, the month is August 2020, you will see from July 2020 back to August 2019.
- Number of Active Members in the last 5 years: 5 different coloured lines for each year showing the number of ACTIVE members for each month. You can change the start and end months of the years by selecting from the Financial Year dropdown box and clicking ‘Show’.

Financial and Loans
All the charts in this group are working on a specific financial year, first, choose which financial year your Toy Library is using from the dropdown menu and click ‘Show’. 
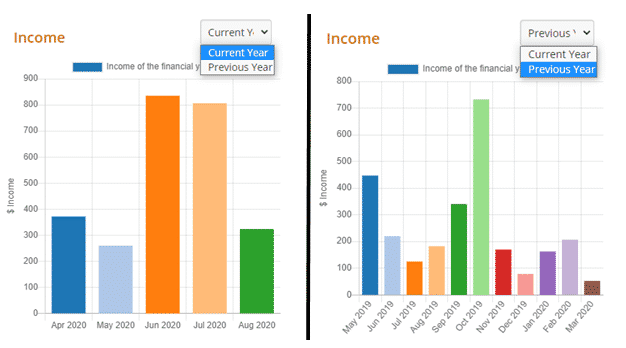
- Income: a bar chart with the total income for the month. In this chart, you can see either the current financial year or the previous.

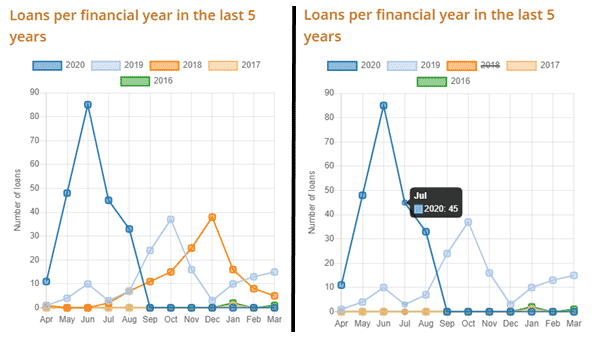
- Loans in the last 5 years: a line chart displaying the total number of toy loans per month for 5 years. Again, as mentioned above, you can remove a year from the chart, for example, click 2018.
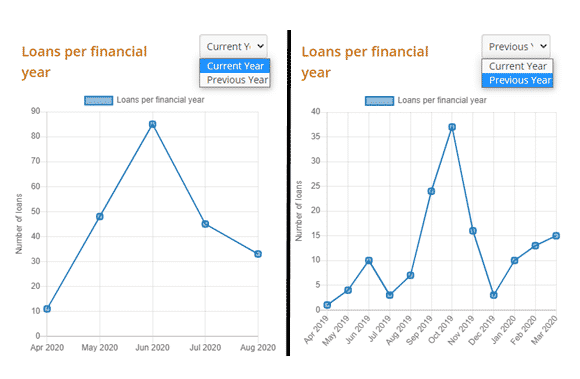
- Loans per financial year: a line chart displaying the total number of toy loans per month. In this chart, you can see the current financial year or previous.
Toys
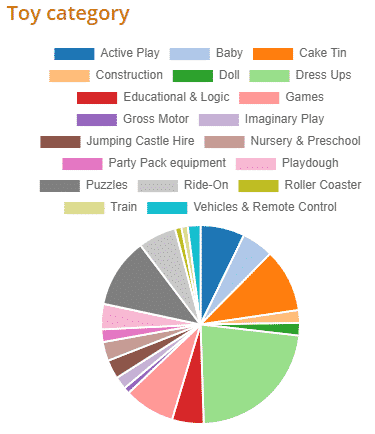
- Toy Category: a pie chart displaying all your library’s toy categories.
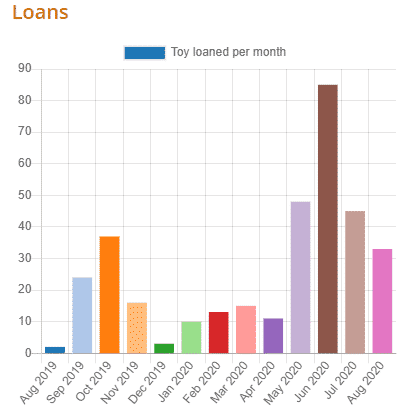
- Toy loaned: a bar chart displaying the number of toys loaned per month during the current year starting from the month when you accessed this chart. For example, the month is August 2020, you will see from August 2020 back to August 2019.
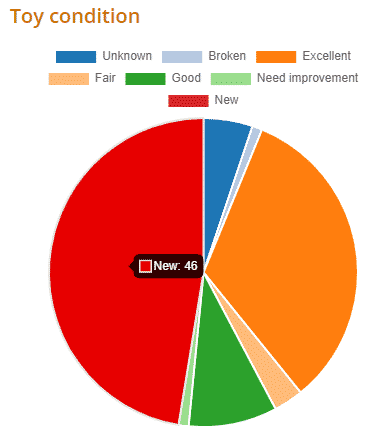
- Toy condition: a pie chart displaying the different conditions of your ACTIVE toys. This chart is also on the Toy Condition page.
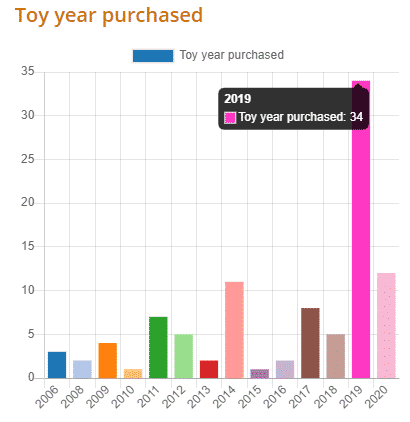
- Toy year purchased: a bar chart displaying the number of new toys purchased for that year.
The post Using the Dynamic Dashboard page appeared first on MiBase New Zealand.
]]>The post Toy Stat page appeared first on MiBase New Zealand.
]]>Go to Toy -> Toy Stat 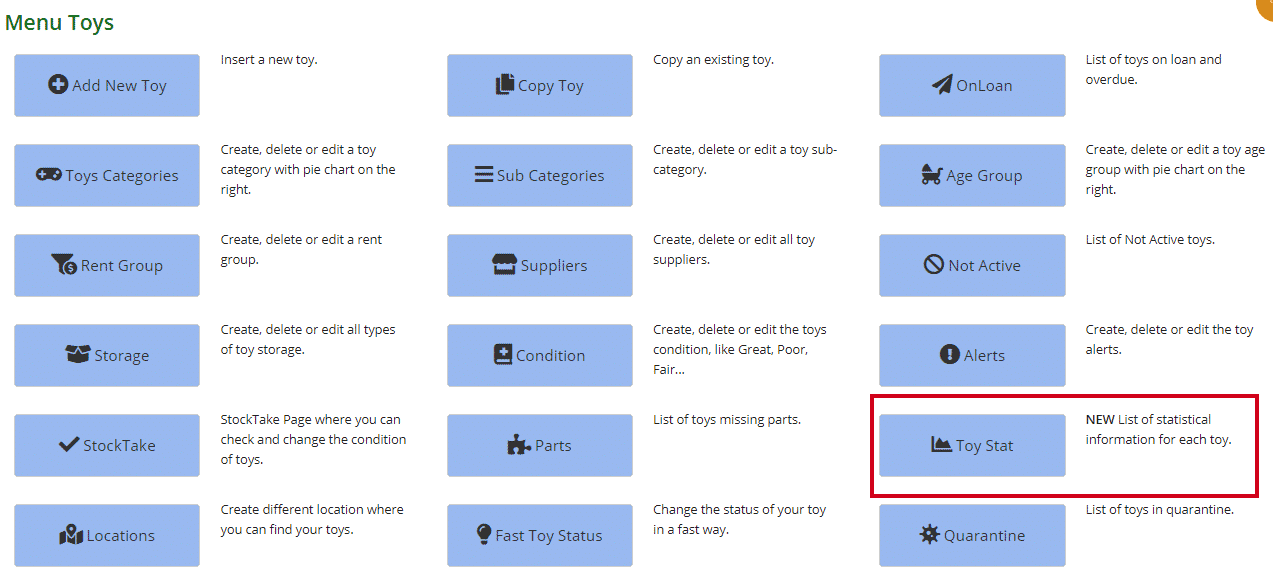
As you can see from the page, there is quite a lot of information listed there. See below for explanations of each column.
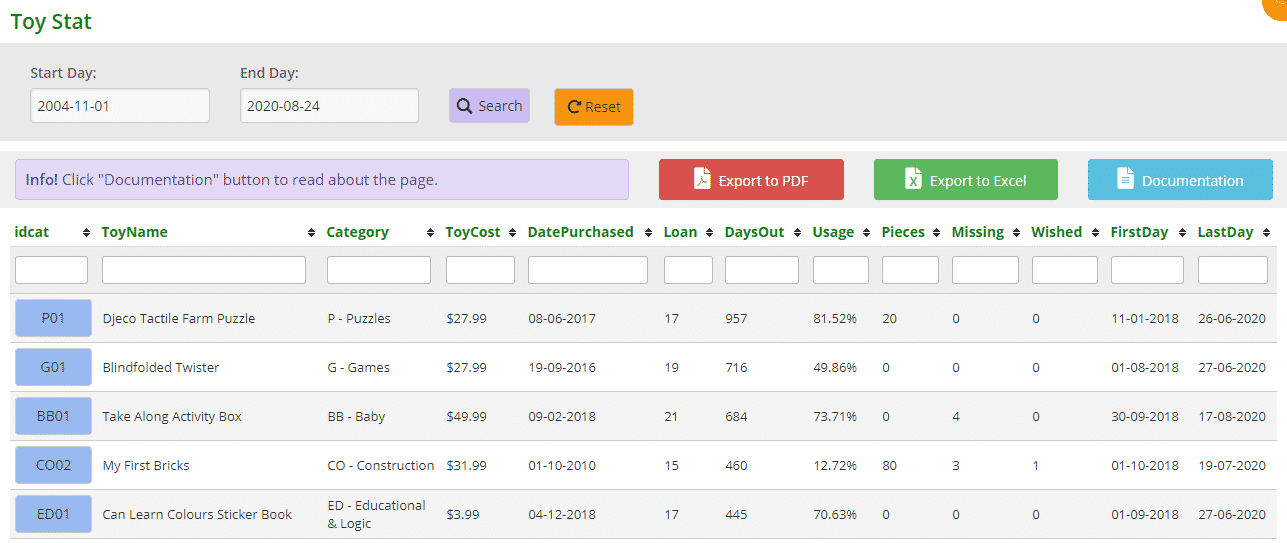
- idcat: toy ID number. If the box is blue, an image has been uploaded, if it is white there is no image
- ToyName: toy name
- Category: category ID and category description
- ToyCost: cost of the toy
- Date Purchased: when the toy was bought or received, this date needs to be correct for the following stats to be accurate
Note: if the date purchased is red, it means that the date is before 31-12-1990, so it is too old to be correct! - Loan: how many times the toy has been loaned
- DaysOut: how many days the toy has been out on loan, this includes days overdue
- Usage: it is a calculation from when the toy was bought and how many days the toy was out (DaysOut/DaysFrom Purchase*100)
If the number is 0%, it means either the toy is not popular or it is a very recent purchase
This figure is important for determining a toy’s popularity, or not - Pieces: the number of pieces
- Missing: the number of missing pieces. This figure is good for stocktake
- Wished: how many times a member has added this toy to the wishlist and the toy has been reserved/loaned
- FirstDay: the first day the toy has been loaned
- LastDay: the last day the toy has been loaned
By clicking the blue ‘Documentation’ button on the right you will see a short instruction on this page.
You can also download the list to PDF and/or Excel by clicking the ‘Export to PDF’ or ‘Export to Excel’ buttons. This will export the full list, not a filtered list. If you want to download a filtered list, export to excel and sort or filter through there.
To sort or filter the list, click the arrows next to the heading you want to sort or filter the list by or type in the search boxes underneath the headings. For example:
- By category: type in ‘puzzle’

- By date purchased: type in a date
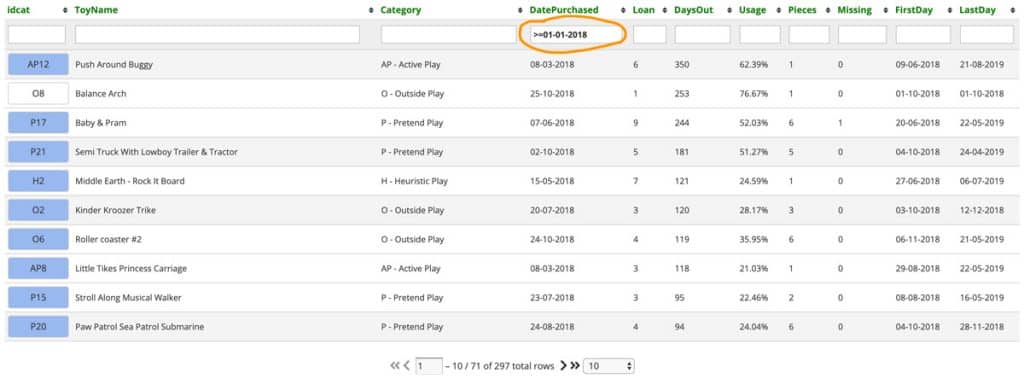
You can use math equations to filter the table if you like to see only the toys with a purchased date after or equal to 01-01-2018, just write in the input:
>=01-01-2018. The pagination on the bottom will tell you how many toys you have in the range, in our case 71
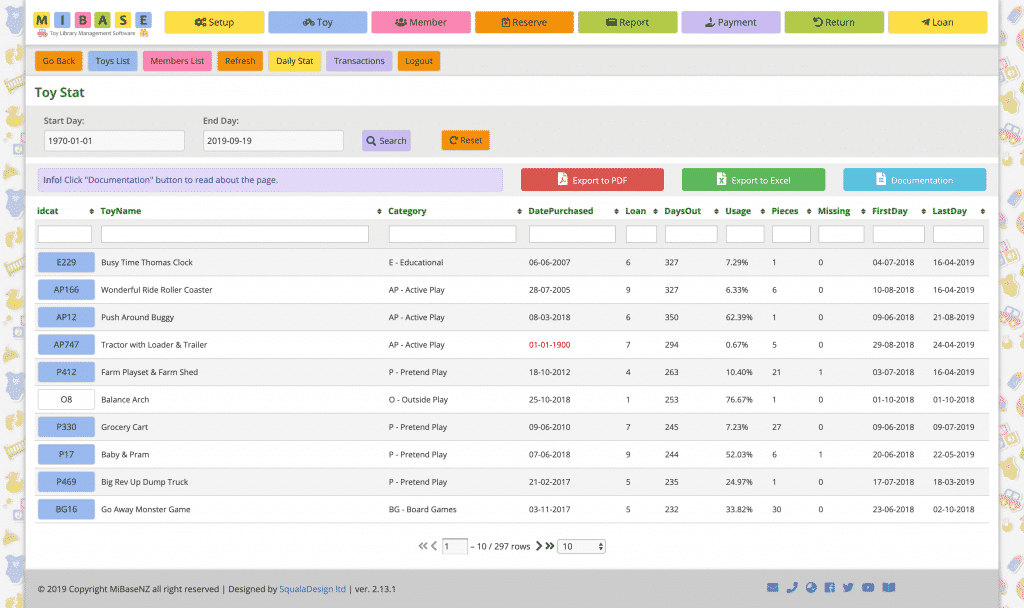
- By dates: To see the statistics in a specific date range, use the Start and End dates on the top of the page. Click Search when you decide the dates and Reset when you like to see all the toys. The default END date is today.
The post Toy Stat page appeared first on MiBase New Zealand.
]]>