How Can We Help?
MiBaseNZ’s Dynamic Dashboard page provides you with all your toy library’s data in a variety of different charts.
Go to Setup -> Dynamic Dashboard 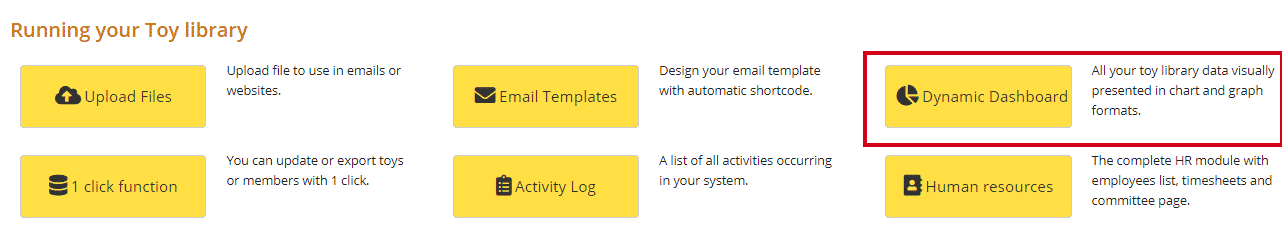
You will see a list of the different charts available with some default charts displayed. To de-activate these charts or to activate others, all you need to do is check the box alongside the chart you would like and click Show. For all ‘Financial and Loans’ charts, you can also choose a financial year from the dropdown menu underneath. If your toy library operates around a different financial year that is not listed, please contact us and we can add it in for you.
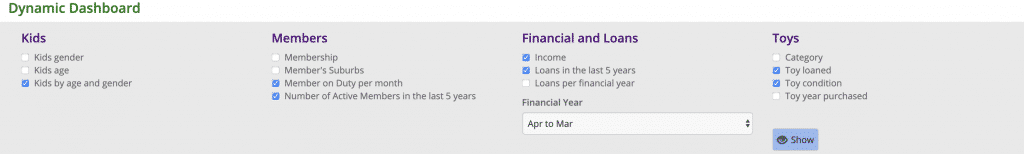
The charts are grouped by category. For all charts, if you hover your mouse over a bar or box or segment of the chart, it will display a total figure.
Note: some charts will mention ACTIVE members, remember expired members are also active!
Kids
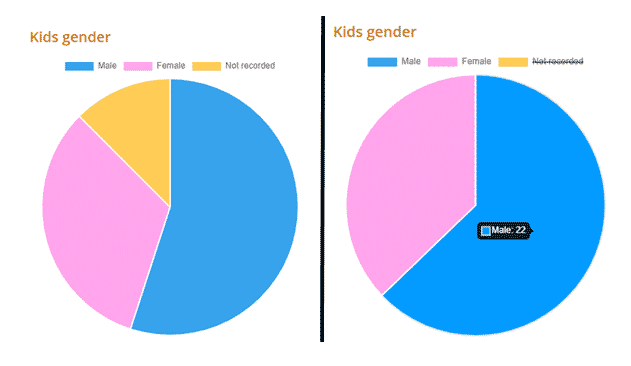
- Kids gender: a pie chart displaying the total number of Males, Females, or Not recorded. It will only show for ACTIVE members. You can click an item on the legend to remove one gender from the chart, for example, click Not recorded and you will only see Males and Females.
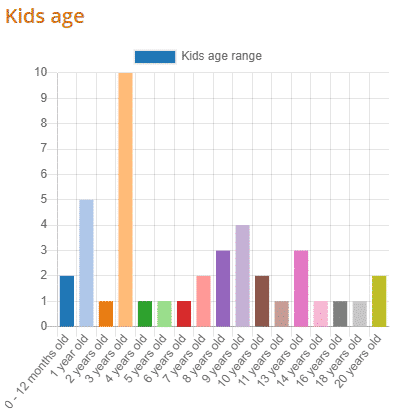
- Kids age: a bar chart with all the kids’ ages for the ACTIVE members.
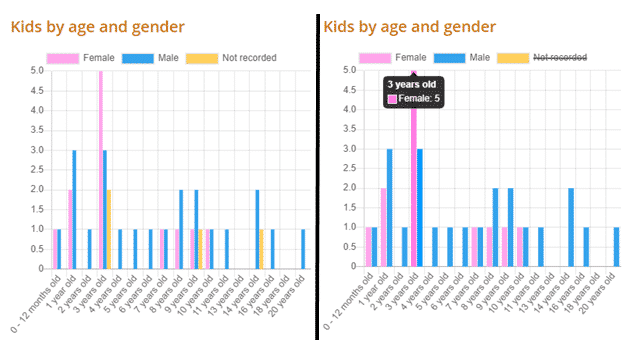
- Kids by age and gender: a bar chart with a composition of the kids’ ages and kids gender. You can click an item on the legend to remove one gender from the chart, for example, click Not recorded and you will only see Females and Males.
Members
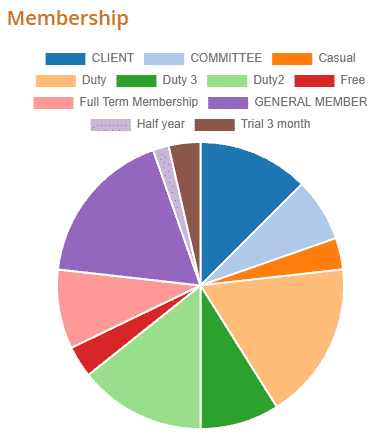
- Membership: a pie chart displaying all your memberships. Very easy to see which one is the most used.
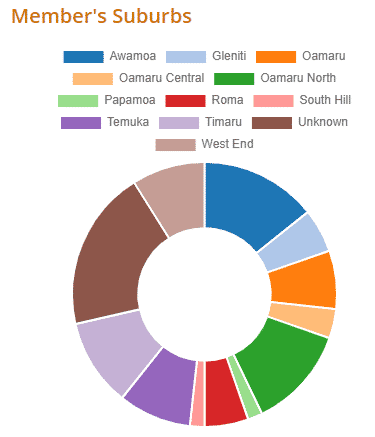
- Member’s Suburbs: a doughnut chart displaying the suburbs your ACTIVE members are living in.
- Member on Duty per month: a bar chart displaying the number of members that completed a duty during the current year starting from the previous month when you accessed this chart. For example, the month is August 2020, you will see from July 2020 back to August 2019.
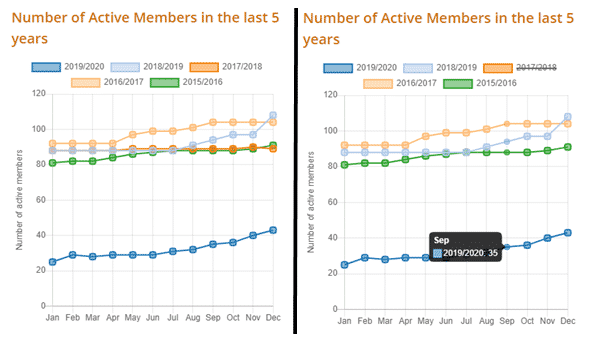
- Number of Active Members in the last 5 years: 5 different coloured lines for each year showing the number of ACTIVE members for each month. You can change the start and end months of the years by selecting from the Financial Year dropdown box and clicking ‘Show’.
Financial and Loans
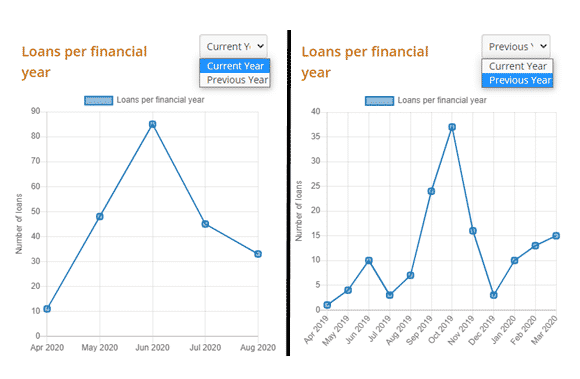
All the charts in this group are working on a specific financial year, first, choose which financial year your Toy Library is using from the dropdown menu and click ‘Show’. 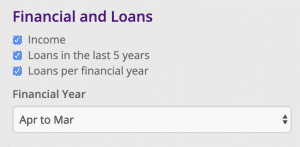
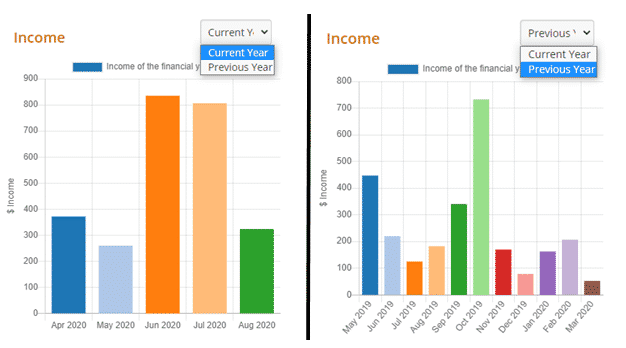
- Income: a bar chart with the total income for the month. In this chart, you can see either the current financial year or the previous.
- Loans in the last 5 years: a line chart displaying the total number of toy loans per month for 5 years. Again, as mentioned above, you can remove a year from the chart, for example, click 2018.
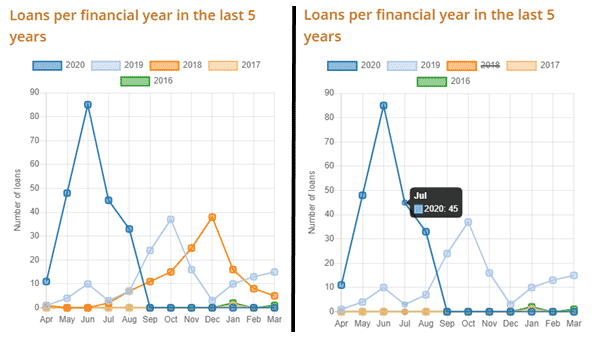
- Loans per financial year: a line chart displaying the total number of toy loans per month. In this chart, you can see the current financial year or previous.
Toys
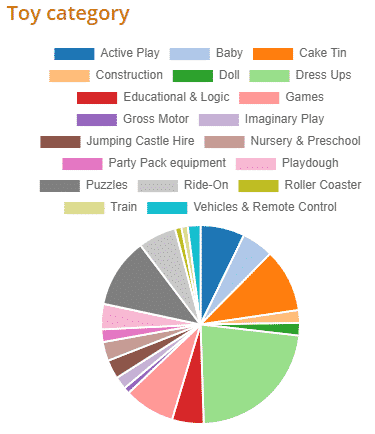
- Toy Category: a pie chart displaying all your library’s toy categories.
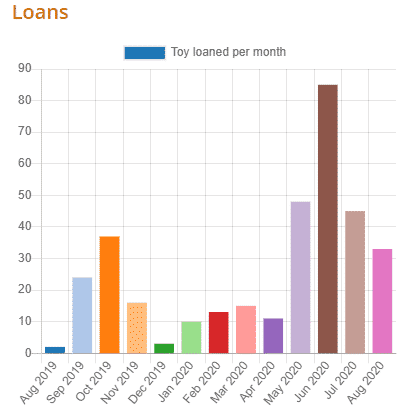
- Toy loaned: a bar chart displaying the number of toys loaned per month during the current year starting from the month when you accessed this chart. For example, the month is August 2020, you will see from August 2020 back to August 2019.
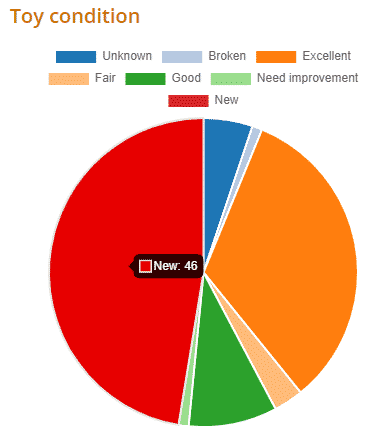
- Toy condition: a pie chart displaying the different conditions of your ACTIVE toys. This chart is also on the Toy Condition page.
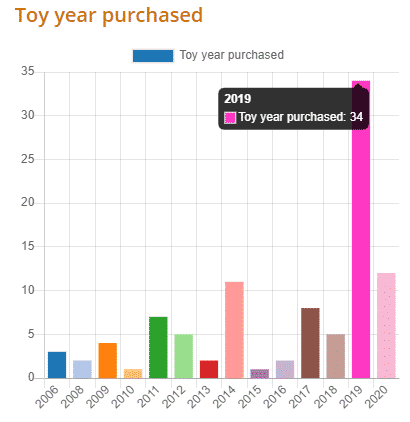
- Toy year purchased: a bar chart displaying the number of new toys purchased for that year.